




دربارهی Sales Data Plotter Lite
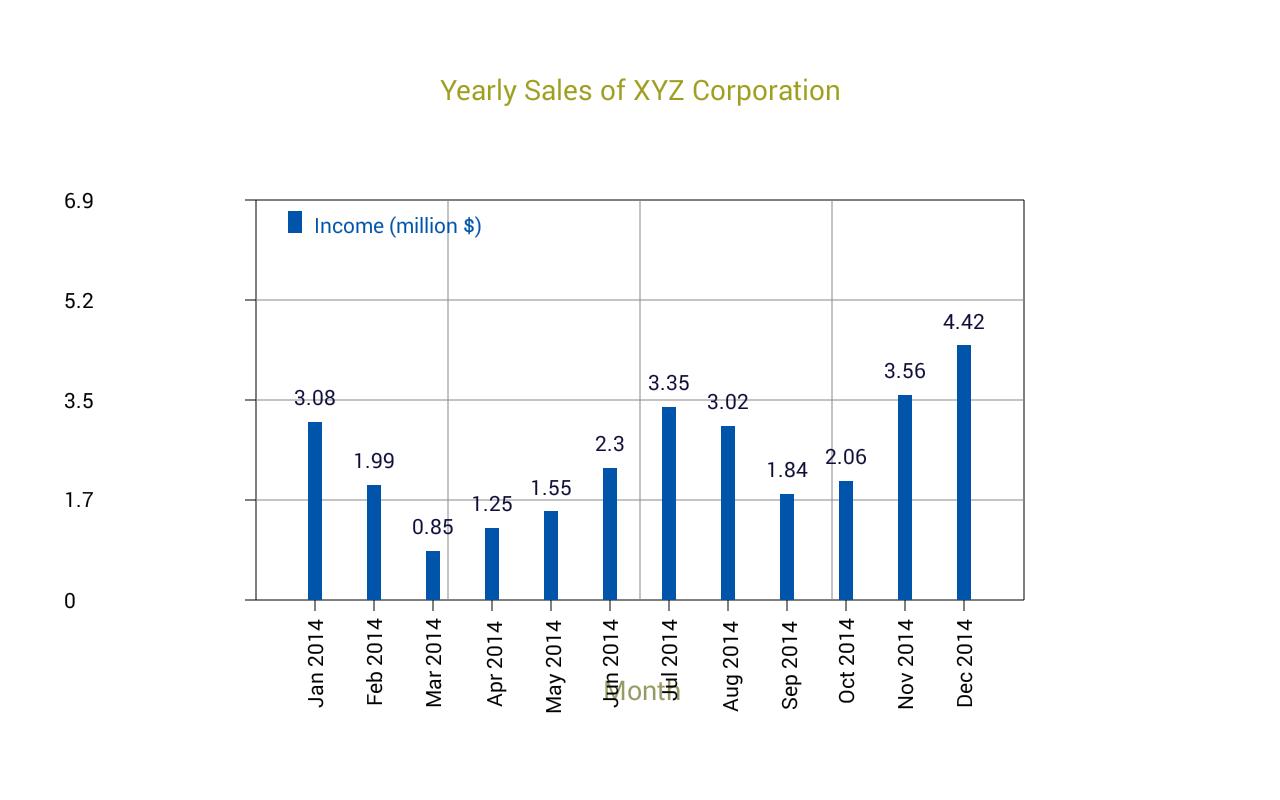
A simple android app for creating colorful graphs of sales related data.
You may use the app to plot your data as line or bar graphs.
Examples of graphs that you may plot :-
Sales figures for a particular product or service for different days in a week, for different days in a month, for different months in a year, for different quarters in a year or for that matter, for different years.
Sales figures for up to 31 different products or services in a particular day, month, quarter or year.
Individual sales figures of a sales executive for different days in a week, for different days in a month, for different months in a year, for different quarters in a year or for that matter, for different years.
Individual sales figures of up to 31 sales executives in a particular day, month, quarter or year. You may also compare your data with another set. For example, you may compare the actual sales of different products in a quarter with the prescribed targets for the same quarter.
For more information, visit the 'Sales Data Plotter' website at
www.android-apps.abhipod.com/salesdataplotter/.
The 'Sales Data Plotter' full version will additionally enable you to :-
Use a secondary Y axis to compare the original data. This is required if the two sets of Y-data are of different nature or have different range of values. For example, the effectiveness of a promotional campaign on the sale of a product may be studied by plotting the sales figures of different sales personnel before the campaign using the original Y axis and plotting the percentage increase or decrease in corresponding sales after the campaign using the secondary Y axis.
Perform simple statistics on the sales data to find the total sales, average sales, standard deviation from the average and more. The stats could, for example, help point out the effectiveness of a promotional campaign on the sales. They may be shown on the graph canvas too.
Zoom the graph canvas to different sizes to be able to view the graph in greater detail. This turns out to be very helpful as the number of rows of data increases.
Save the high resolution on-screen graph image (of original or zoomed size) along with all the data to your phone memory or SD card for taking a print-out on full-sized paper or for displaying on a computer screen or with an LCD projector.
Attach the saved graph and data to an email and send it to your boss or colleague from within the app itself.
Once installed, the app does not require to remain connected to the internet unless you want to use it to visit the 'Sales Data Plotter' website.
The app has been created by :-
Dr. Abhijit Poddar
Dept. of Electronic Sc.
Surendranath Evening College
Kolkata 700009 India
and Ms. Monali Poddar
Dept. of Computer Sc.
Maharaja Manindra Chandra College
Kolkata 700003 India
اطلاعات تکمیلی برنامه
آخرین نسخه
2.2بارگذاری شده توسط
Nda X Panda
نیاز به اندروید
Android 4.2+
دسته بندی
رایگان برنامه انتظام کاررتبهبندی محتوا
Everyone
گزارش
گزارش محتوای نامناسبجدیدترین چیست در نسخهی 2.2
Last updated on 08/01/2019
Bugs removed
Sales Data Plotter Lite اسکرین شات ها


نسخههای قدیمی Sales Data Plotter Lite
تمام نسخهها
برچسب های مرتبط














برای Sales Data Plotter Lite نظر بدهید
افزودن نظرات